Consider event 25 of 150 GeV pion+ run 13159.
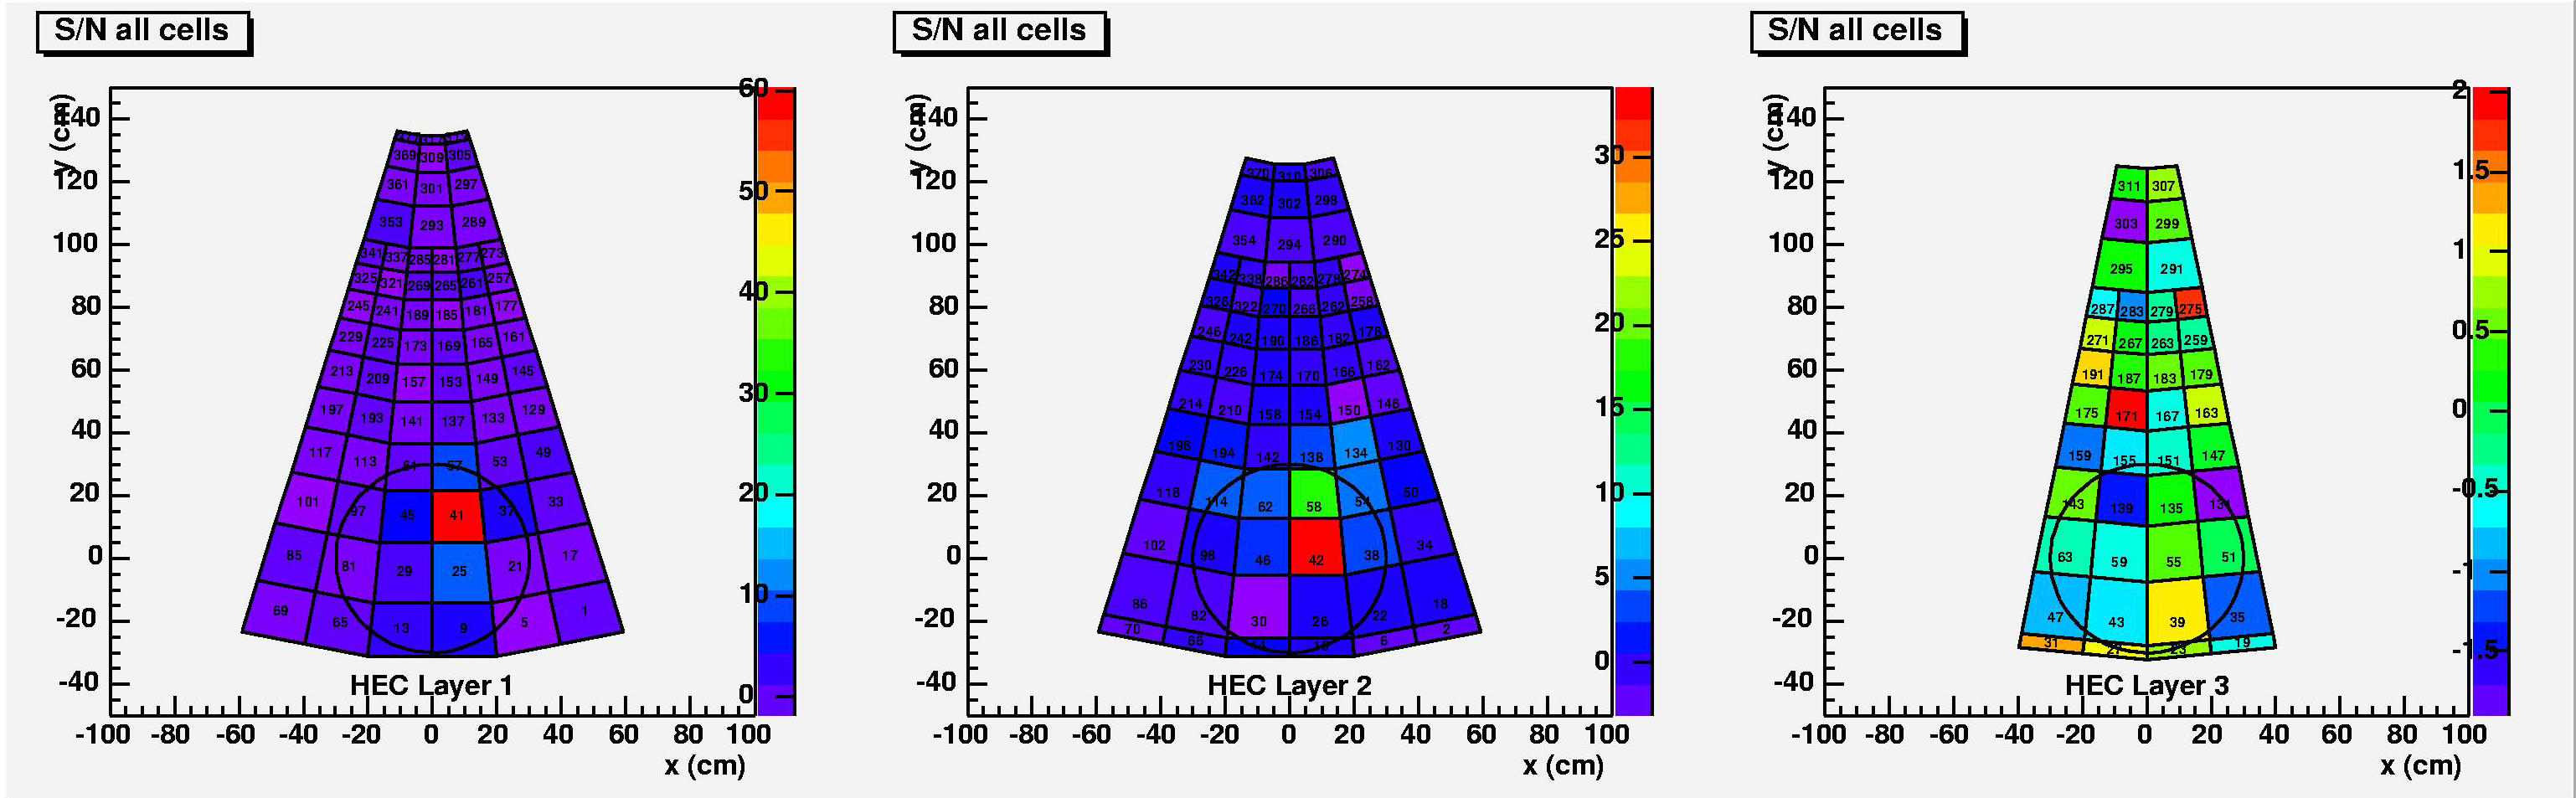
The signal/noise distribution in the HEC is as follows (click on the image to be able to access full size):
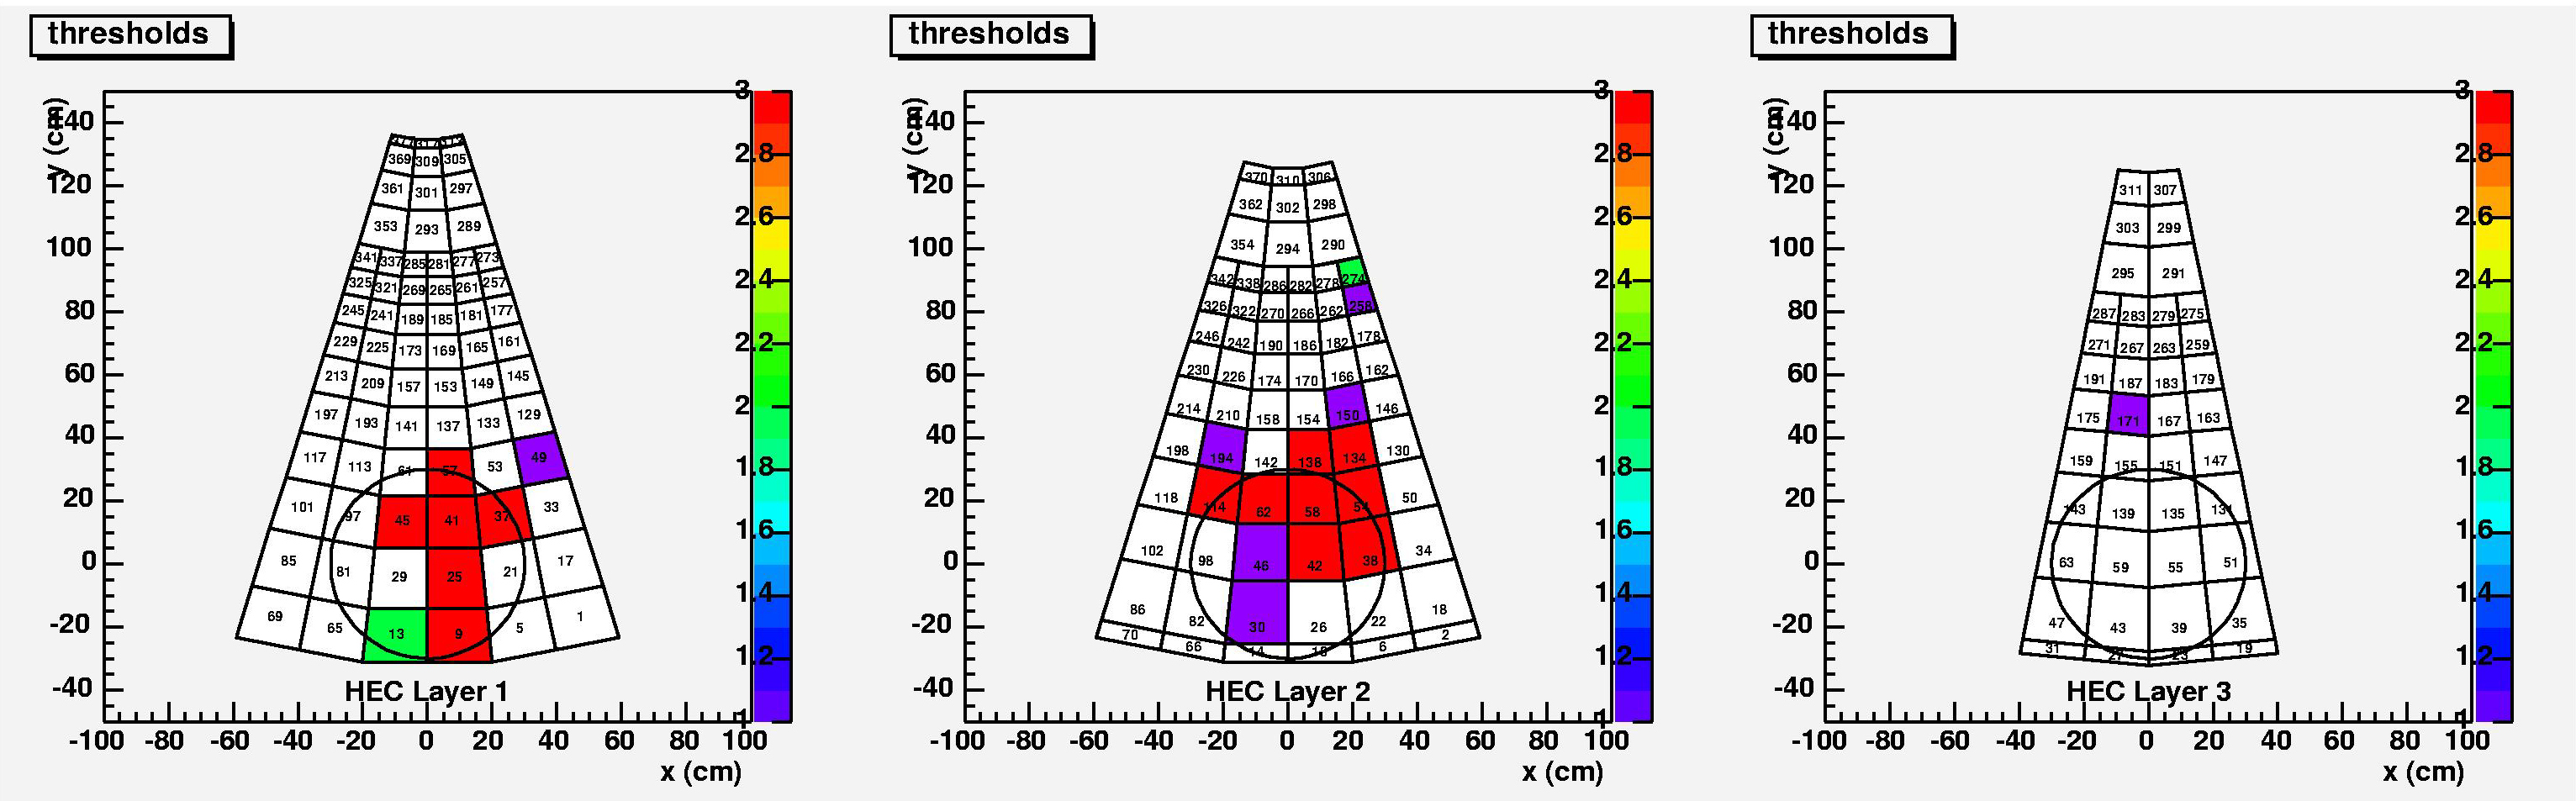
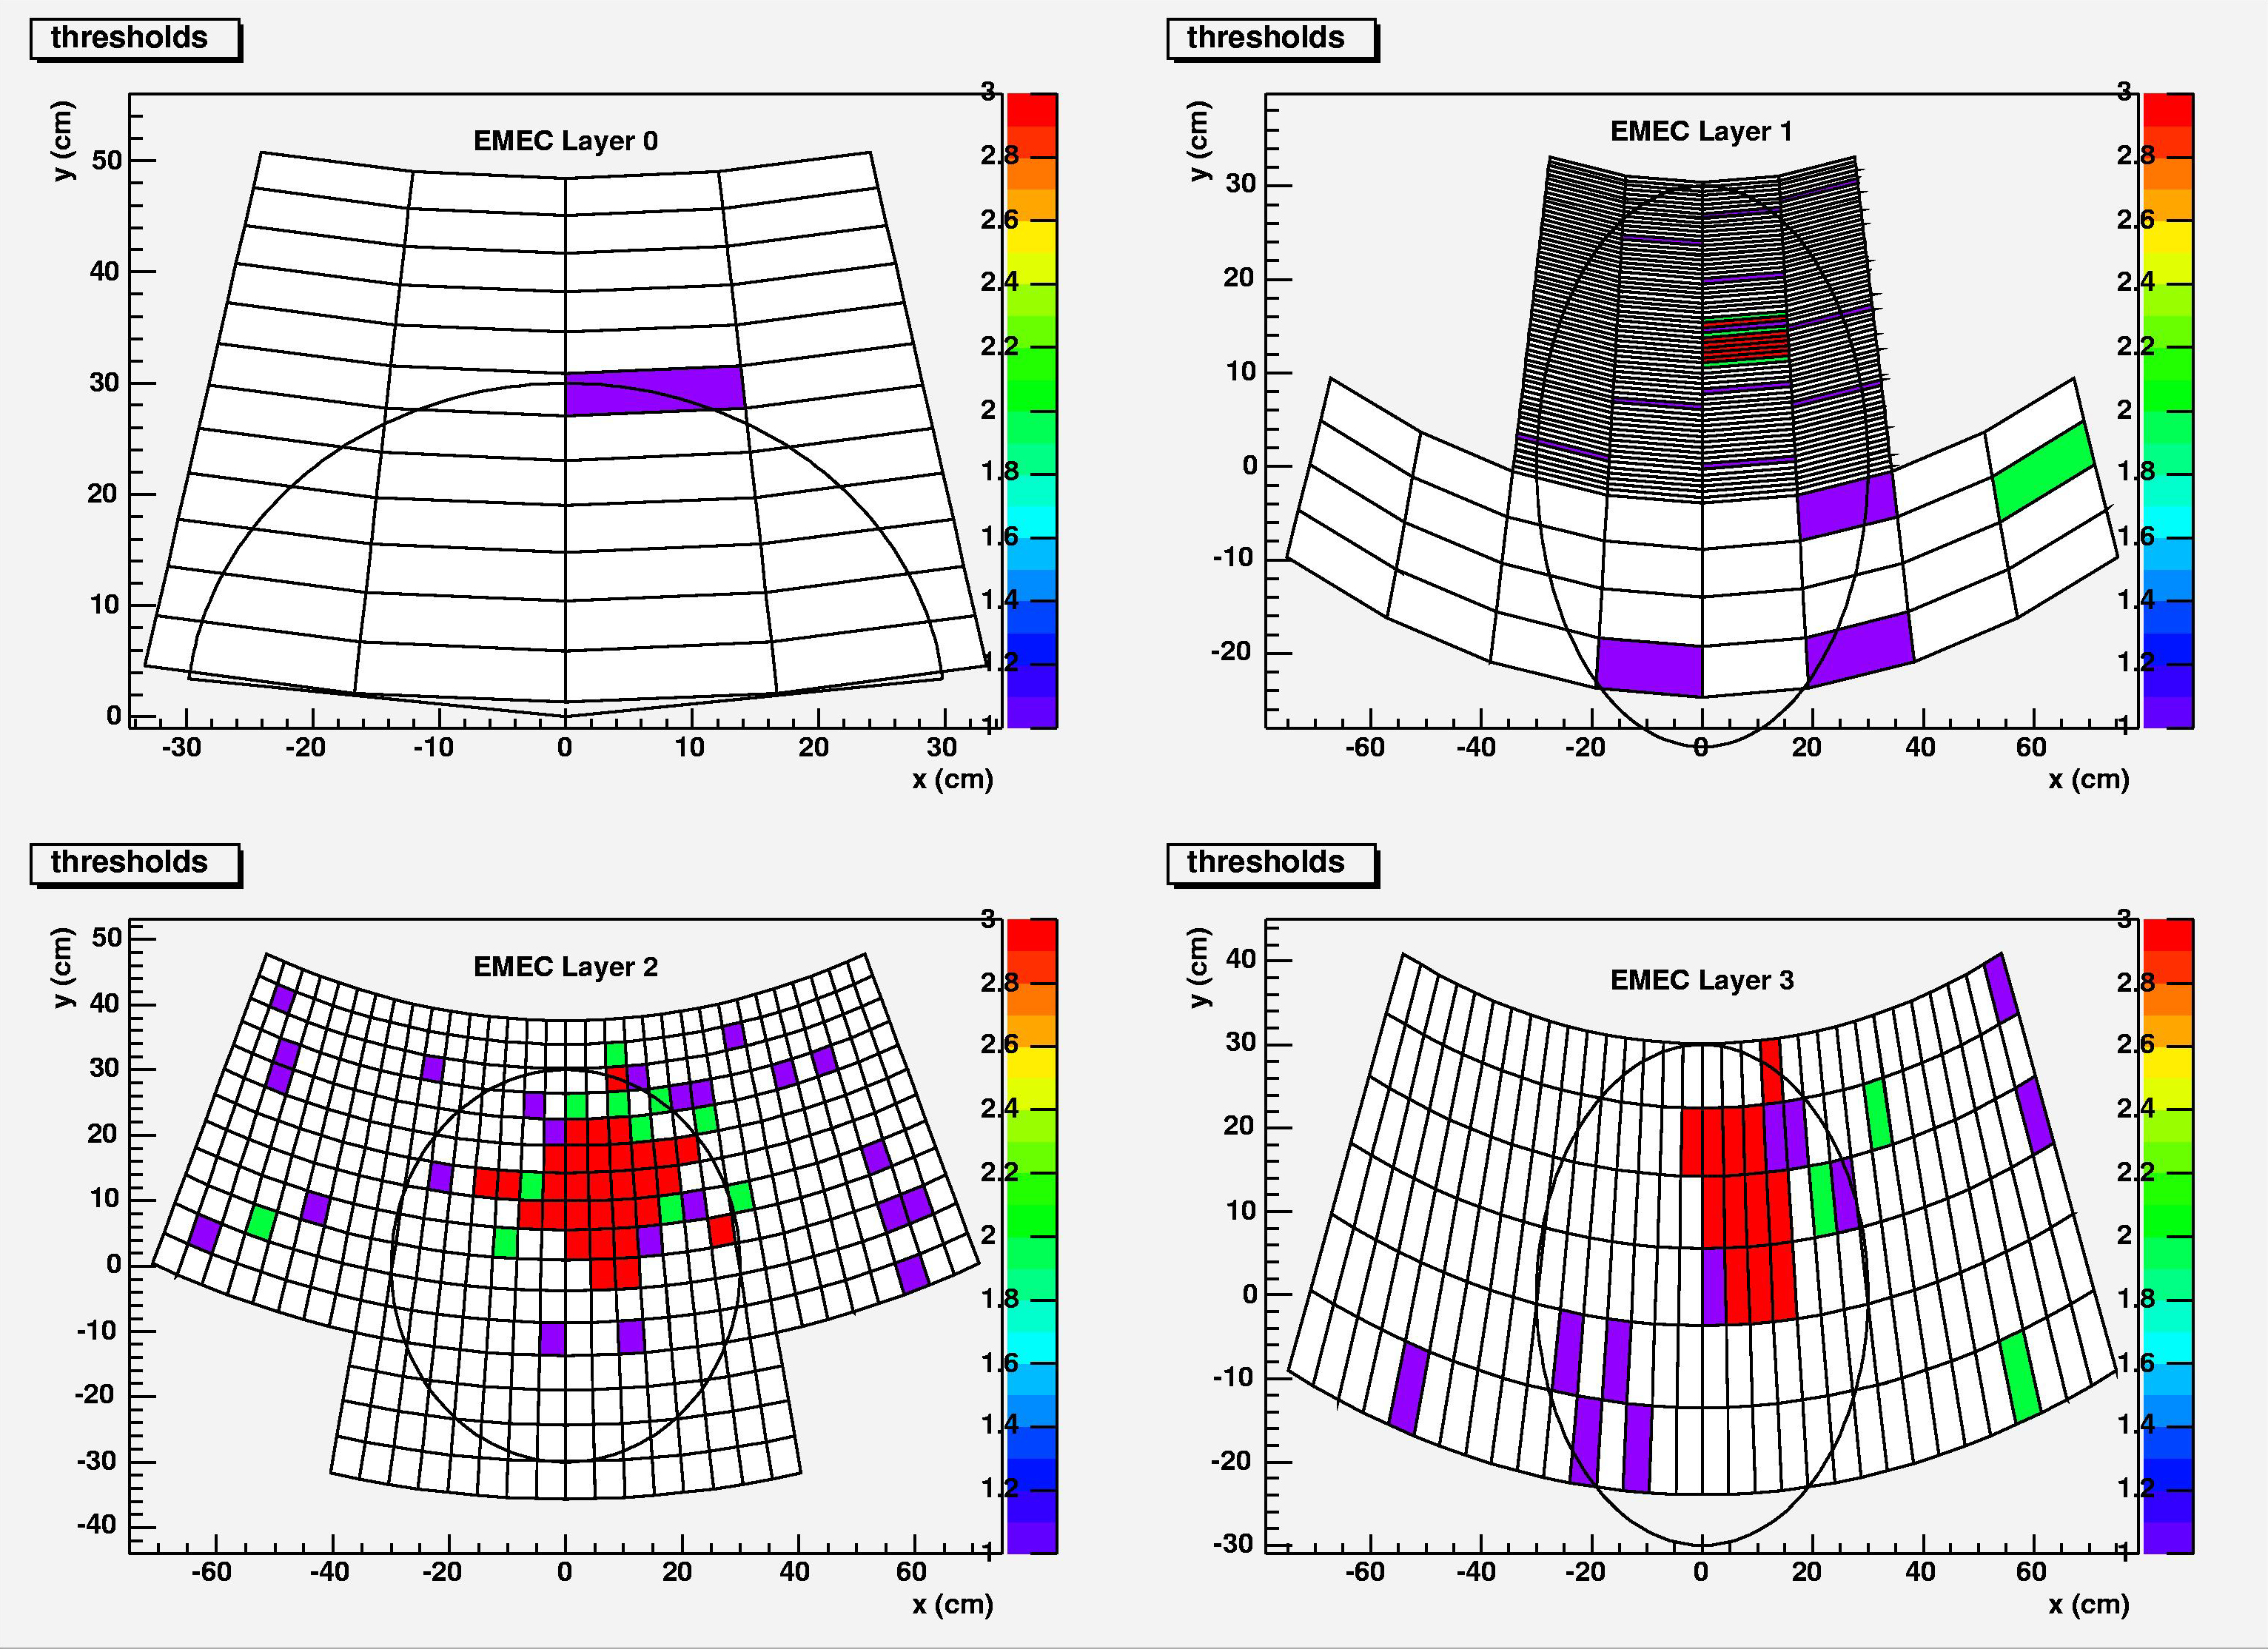
The types of cells for clustering purposes are
3- cells above seed threhold (E > 4 sigma)
2- cells above neighbor threshold (|E| > 3 sigma)
1- cells above cell threshold (|E| > 2 sigma)
This is what is displayed here (red for 3, green for 2 and blue for 1)
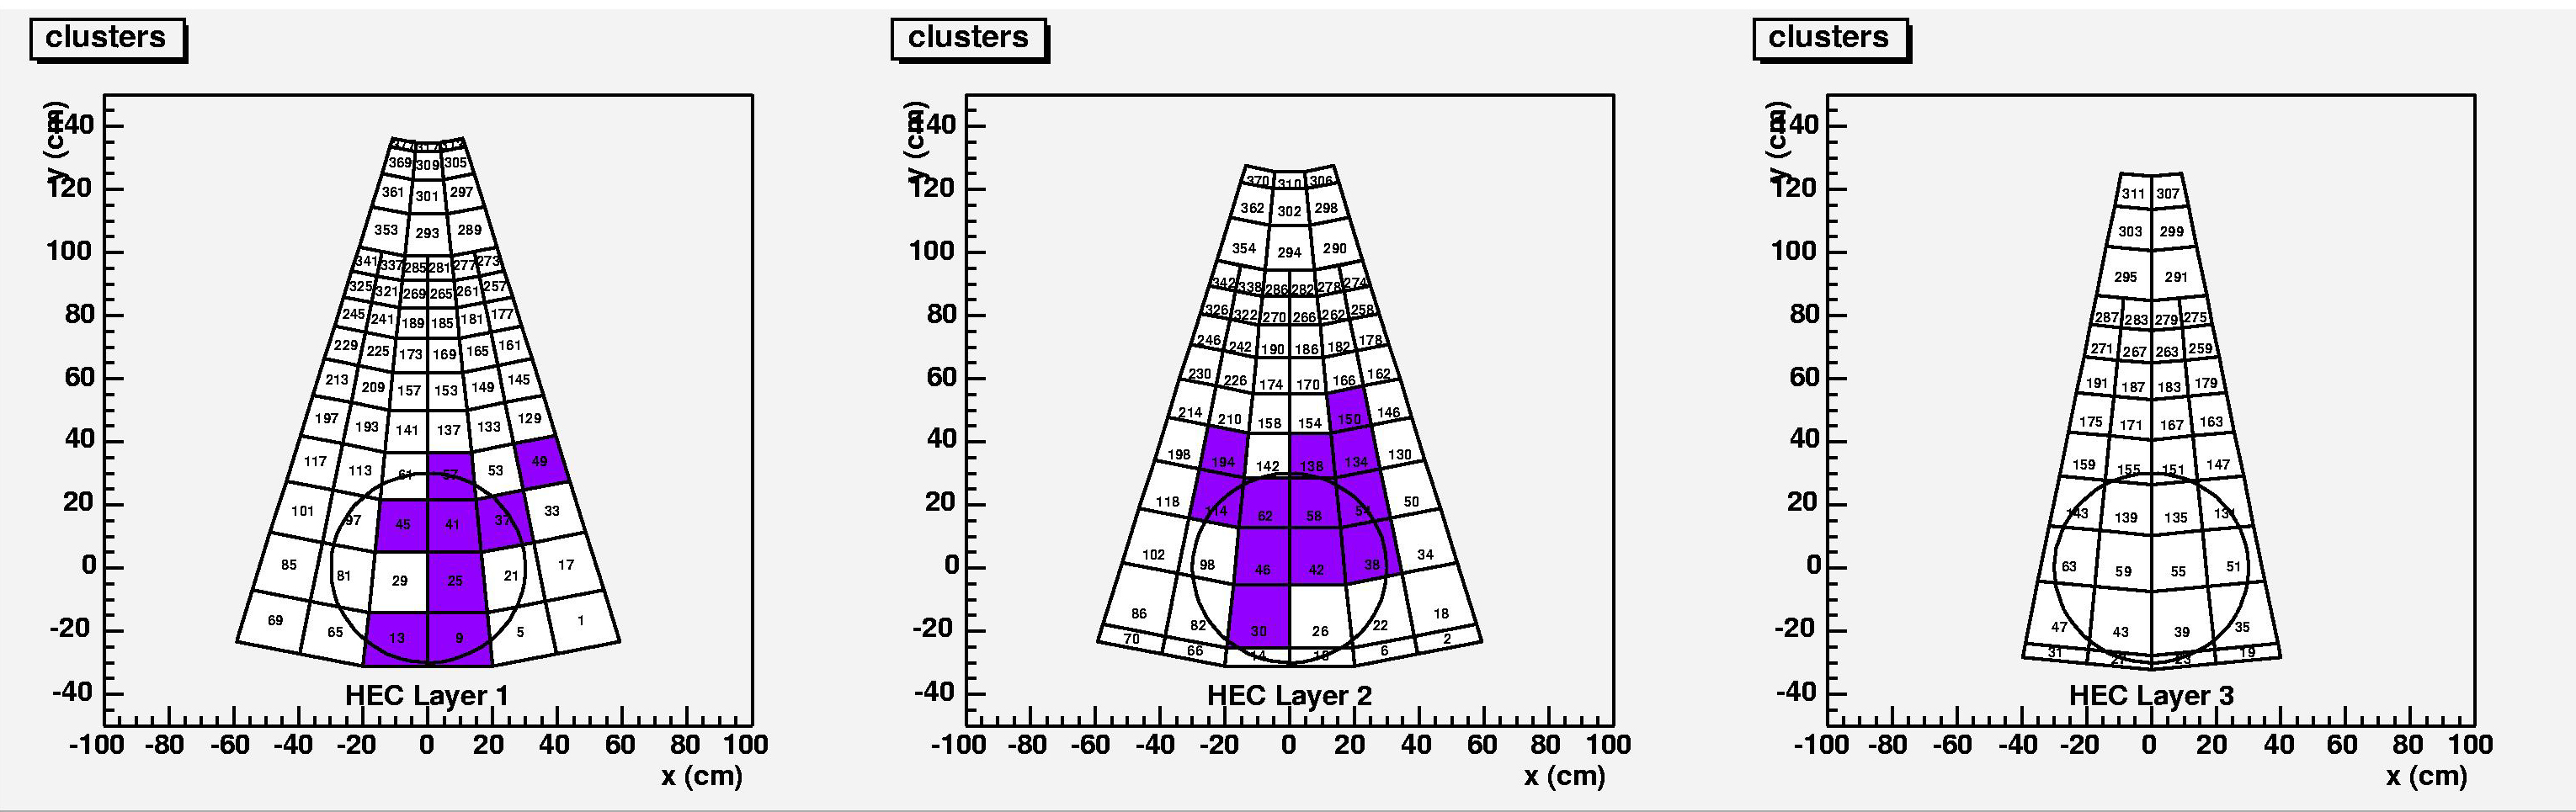
Using 2D clustering (per layer), one obtains the following 2 clusters (labelled 0 and 1)
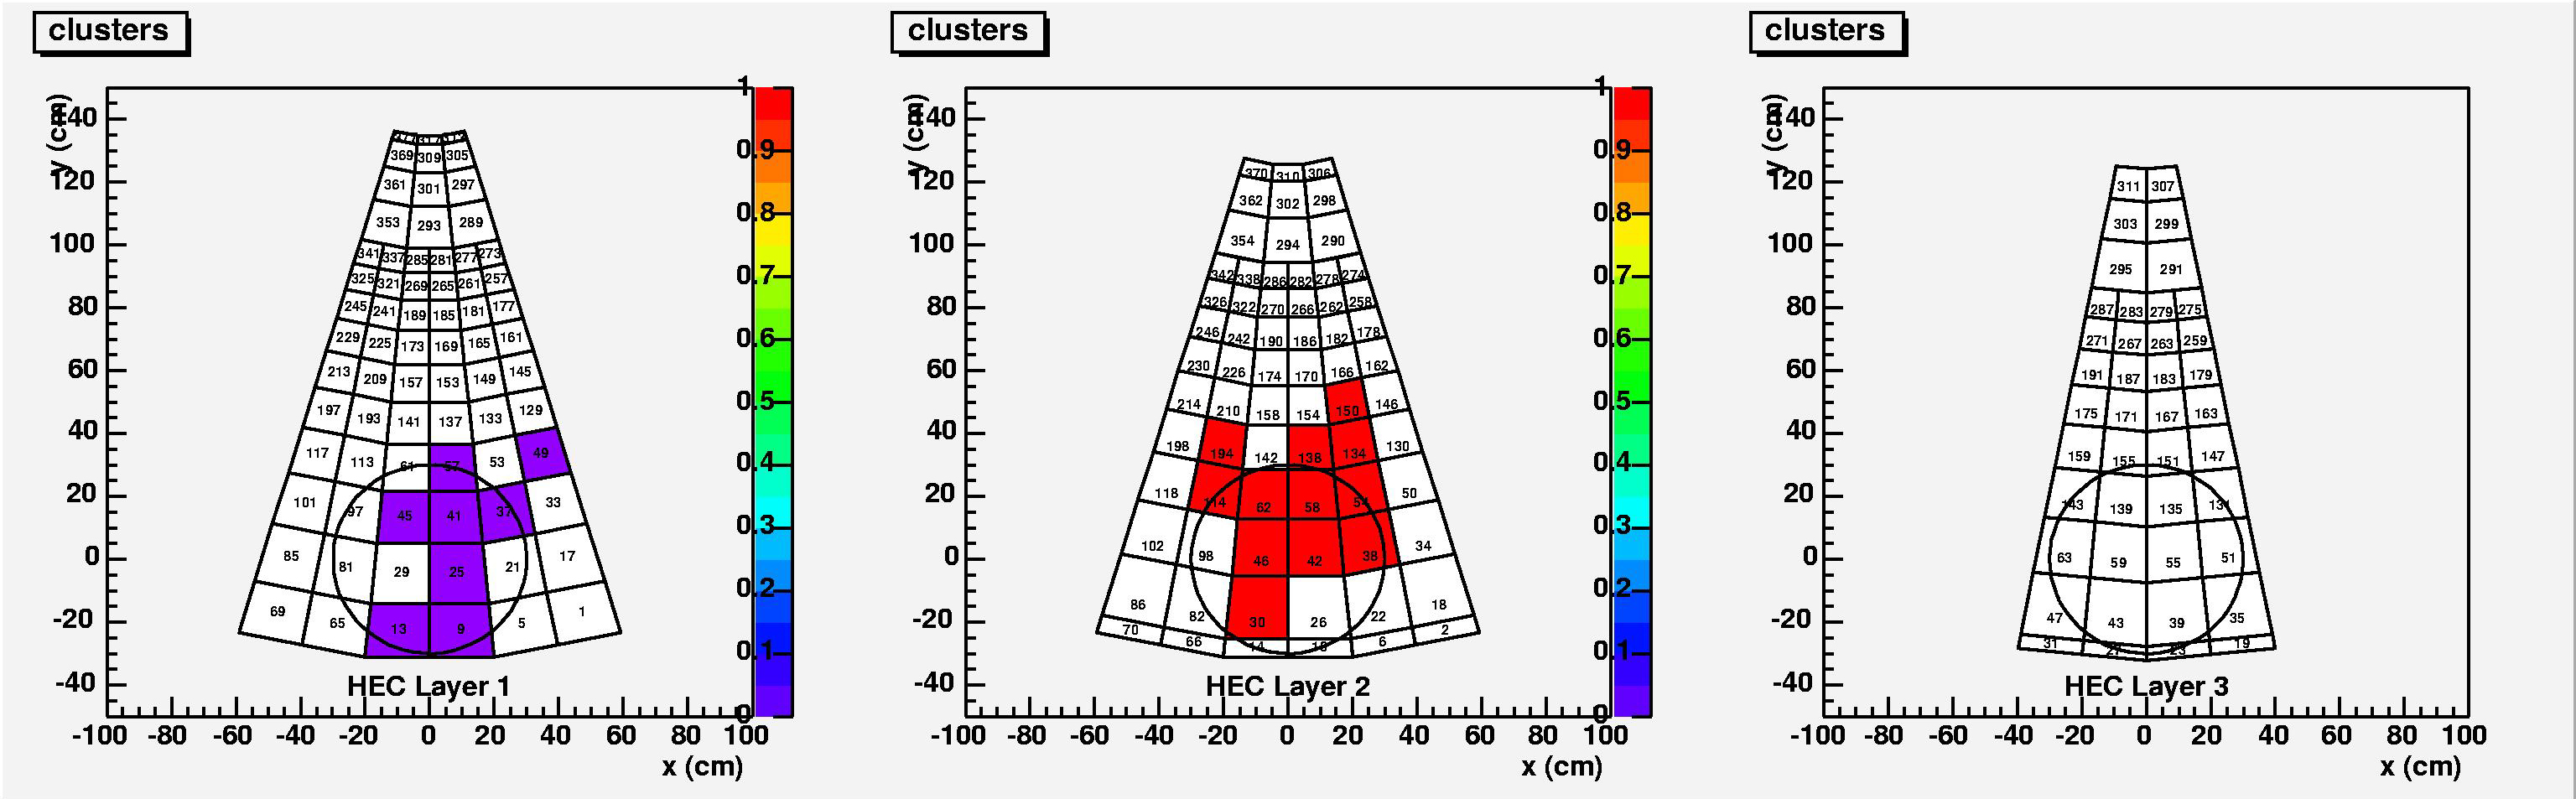
Using 3D clustering (per layer), one obtains the following single cluster
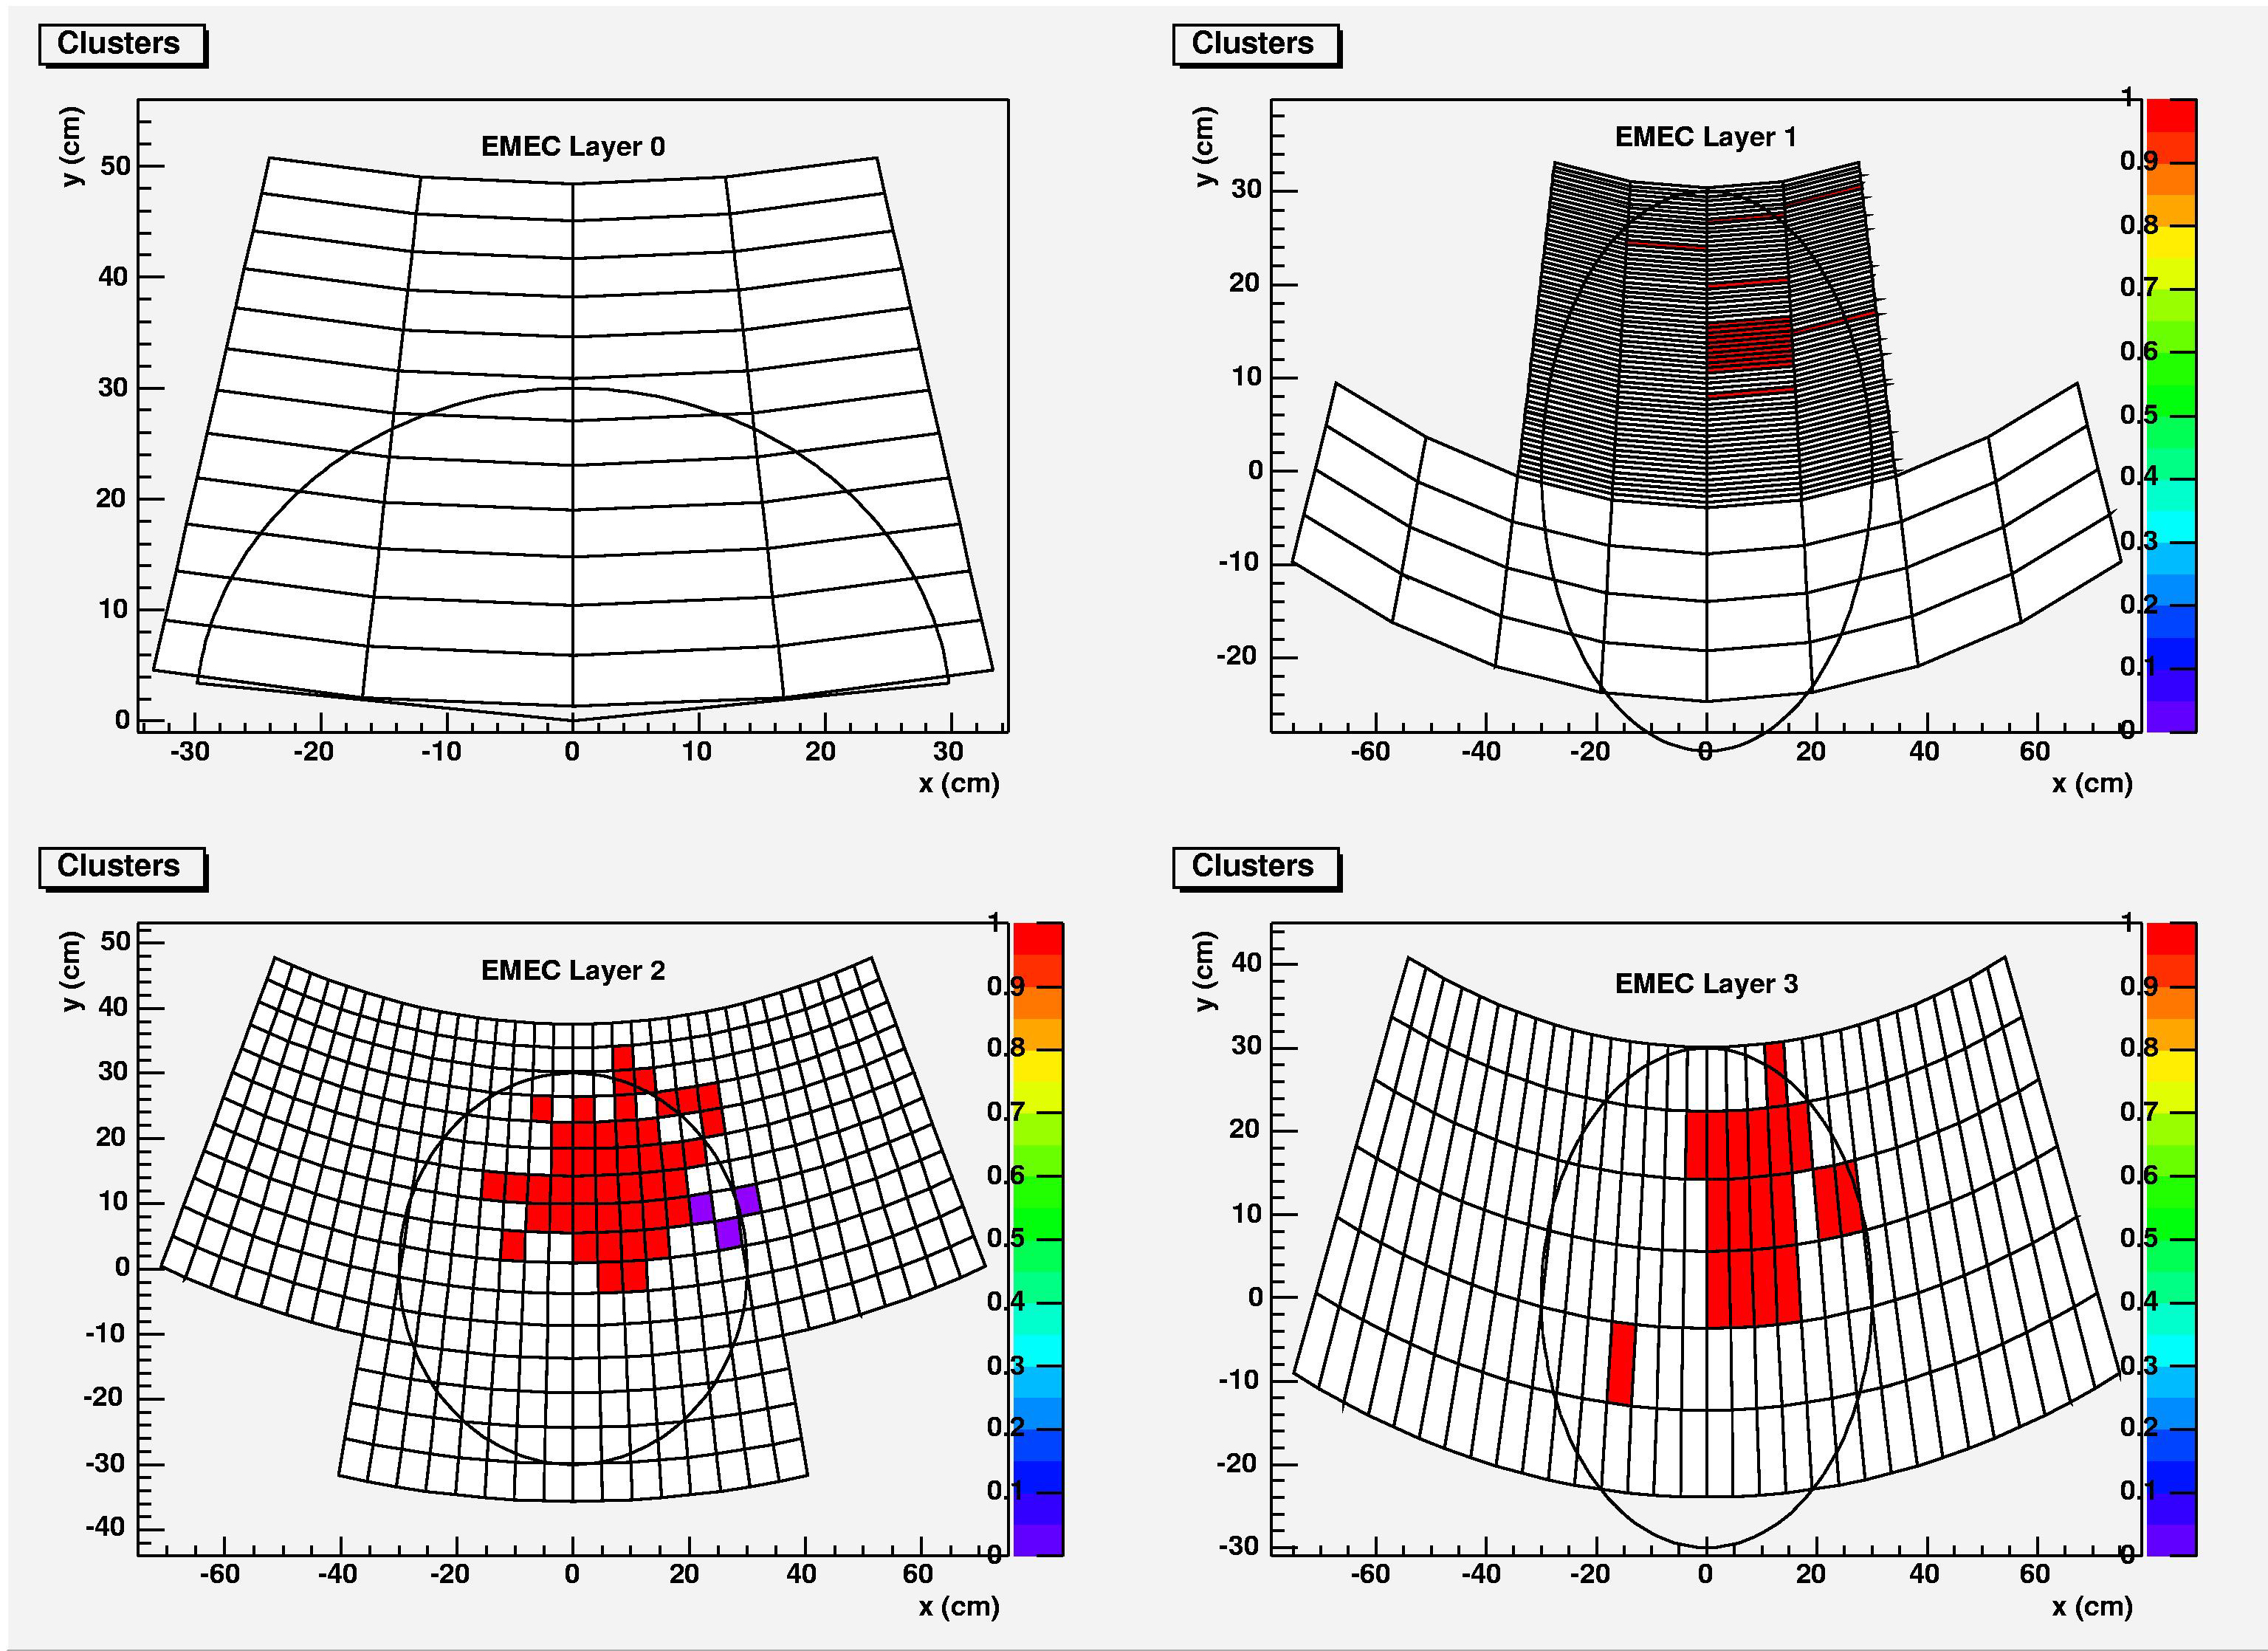
The signal/noise distribution in the EMEC is as follows (click on the image to be able to access full size):
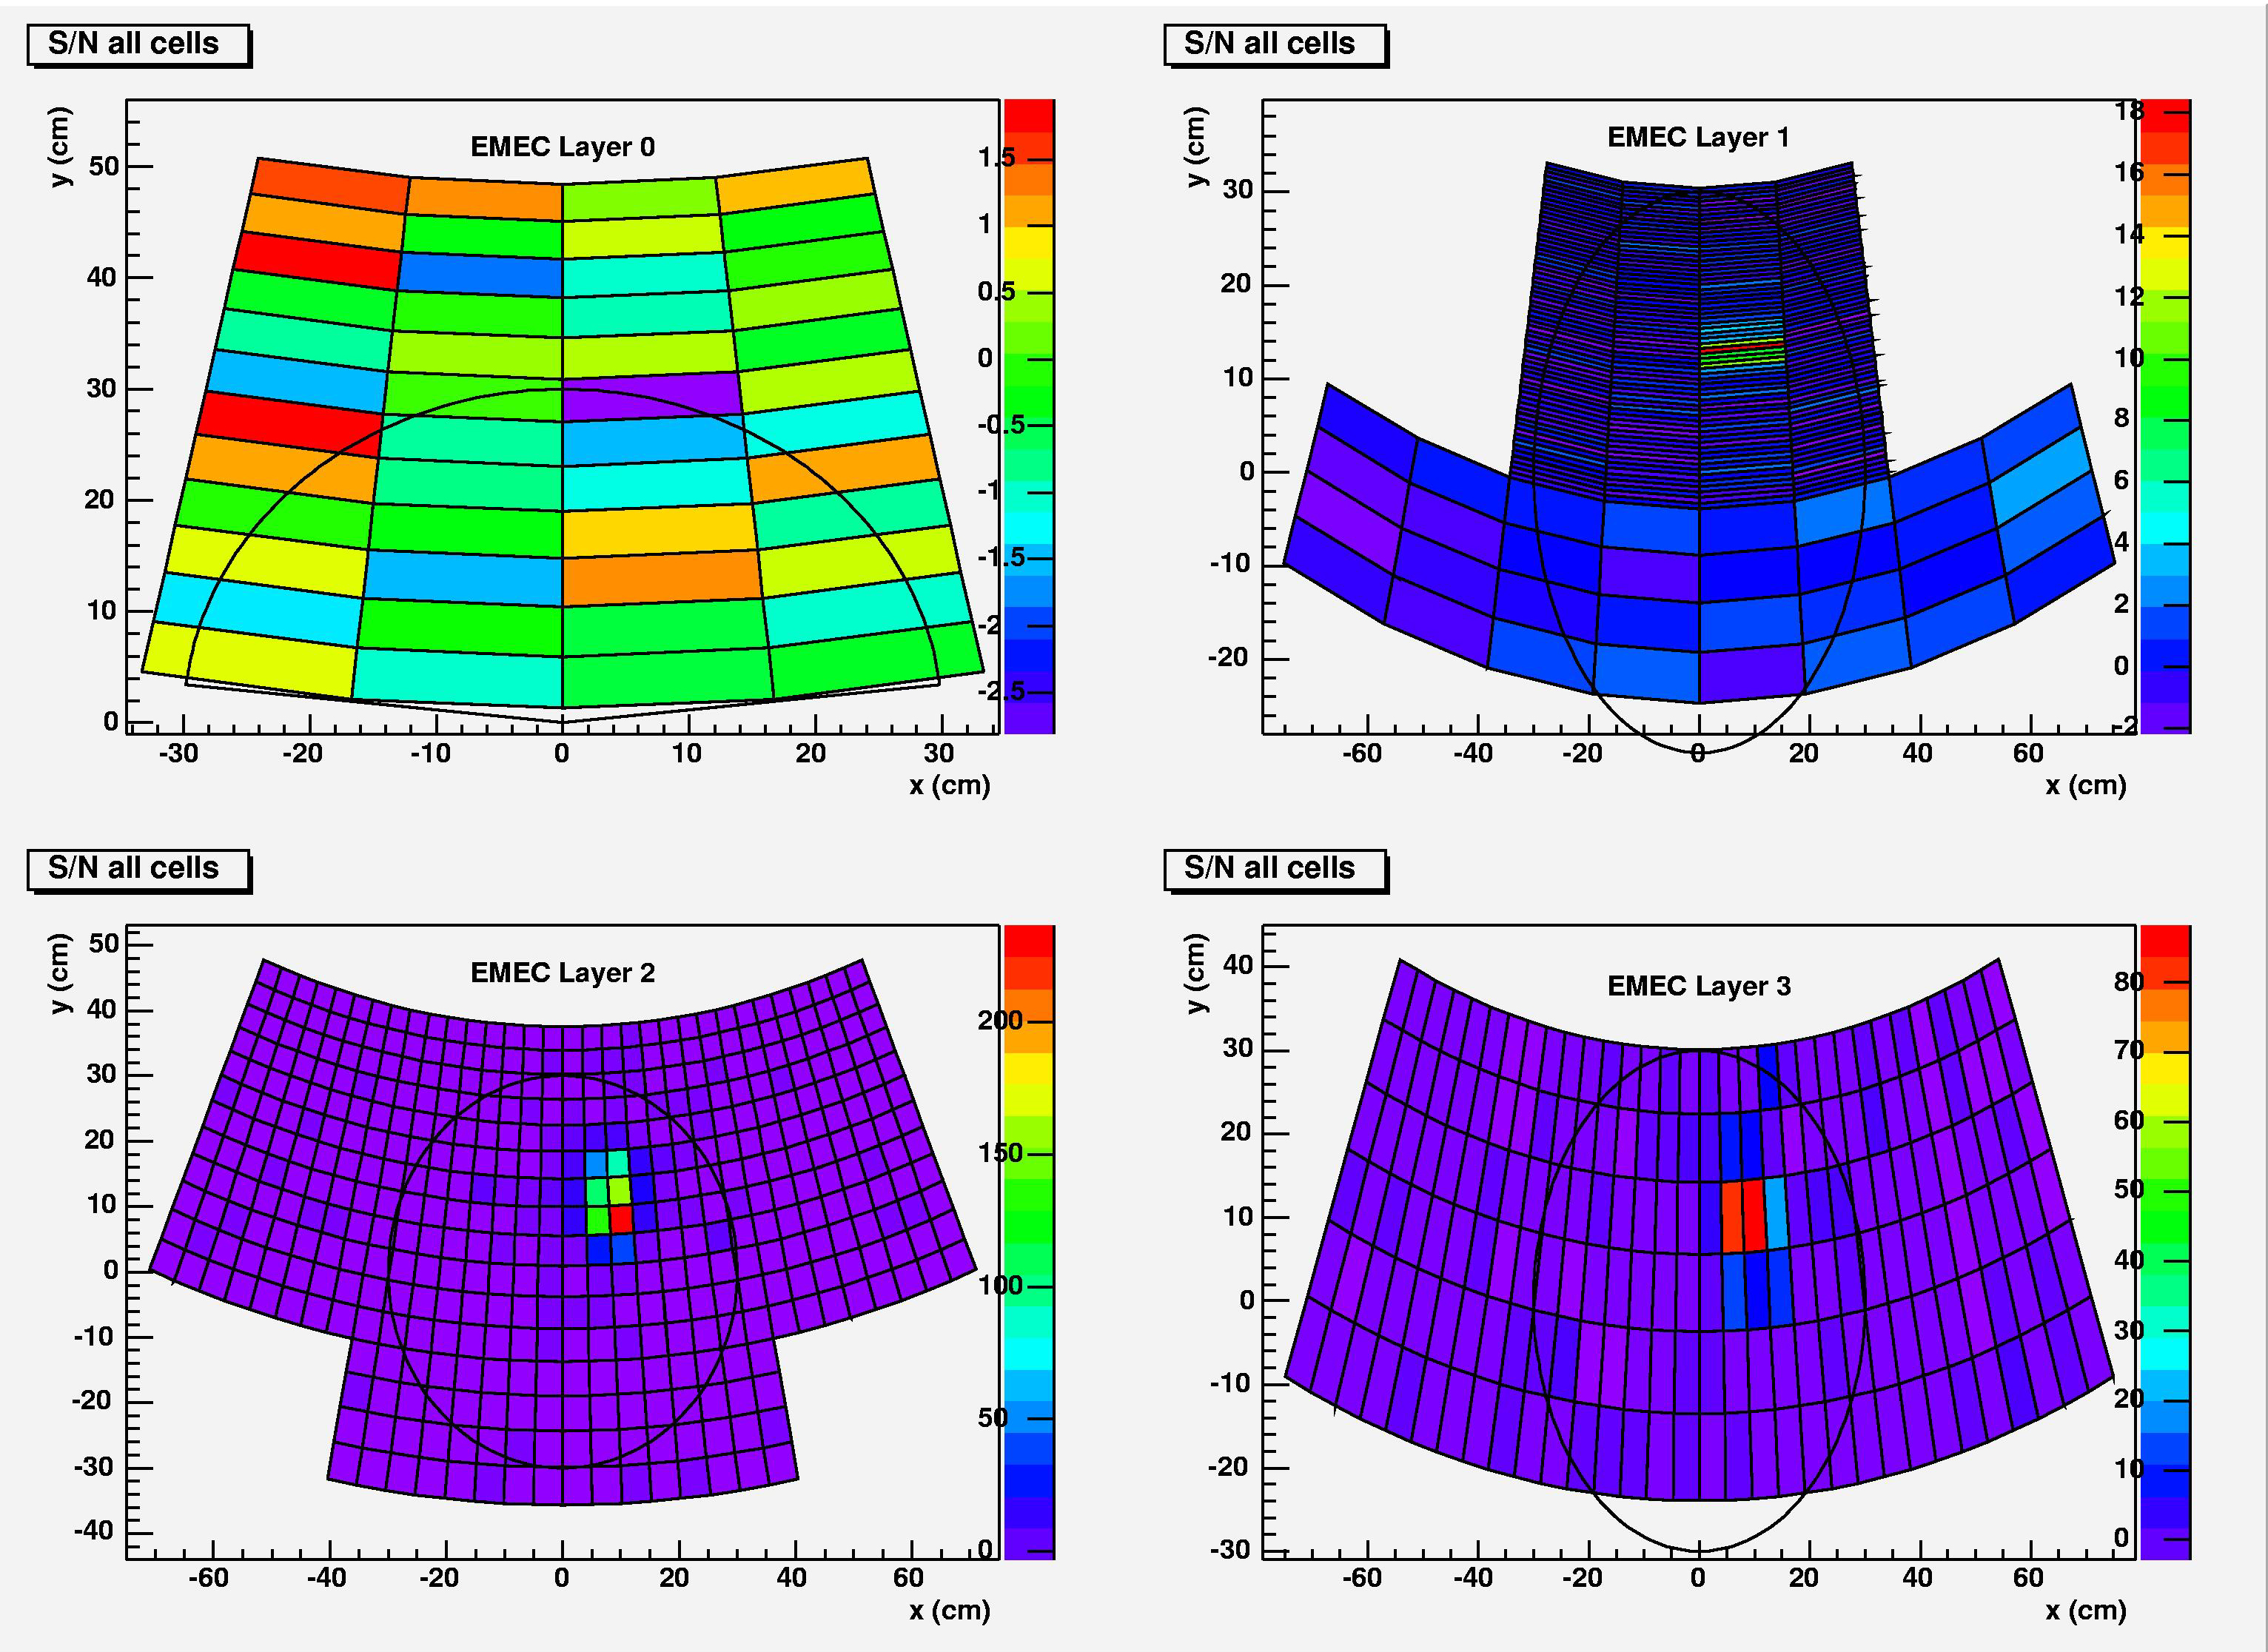
The types of cells for clustering purposes are
3- cells above seed threhold (E > 4 sigma)
2- cells above neighbor threshold (|E| > 3 sigma)
1- cells above cell threshold (|E| > 2 sigma)
This is what is displayed here (red for 3, green for 2 and blue for 1)
Using 2D clustering (per layer), one obtains the following 5 clusters (labelled 0 to 4).
Although it is not easy to see, you will notice in layer 1 that 2 clusters were formed.
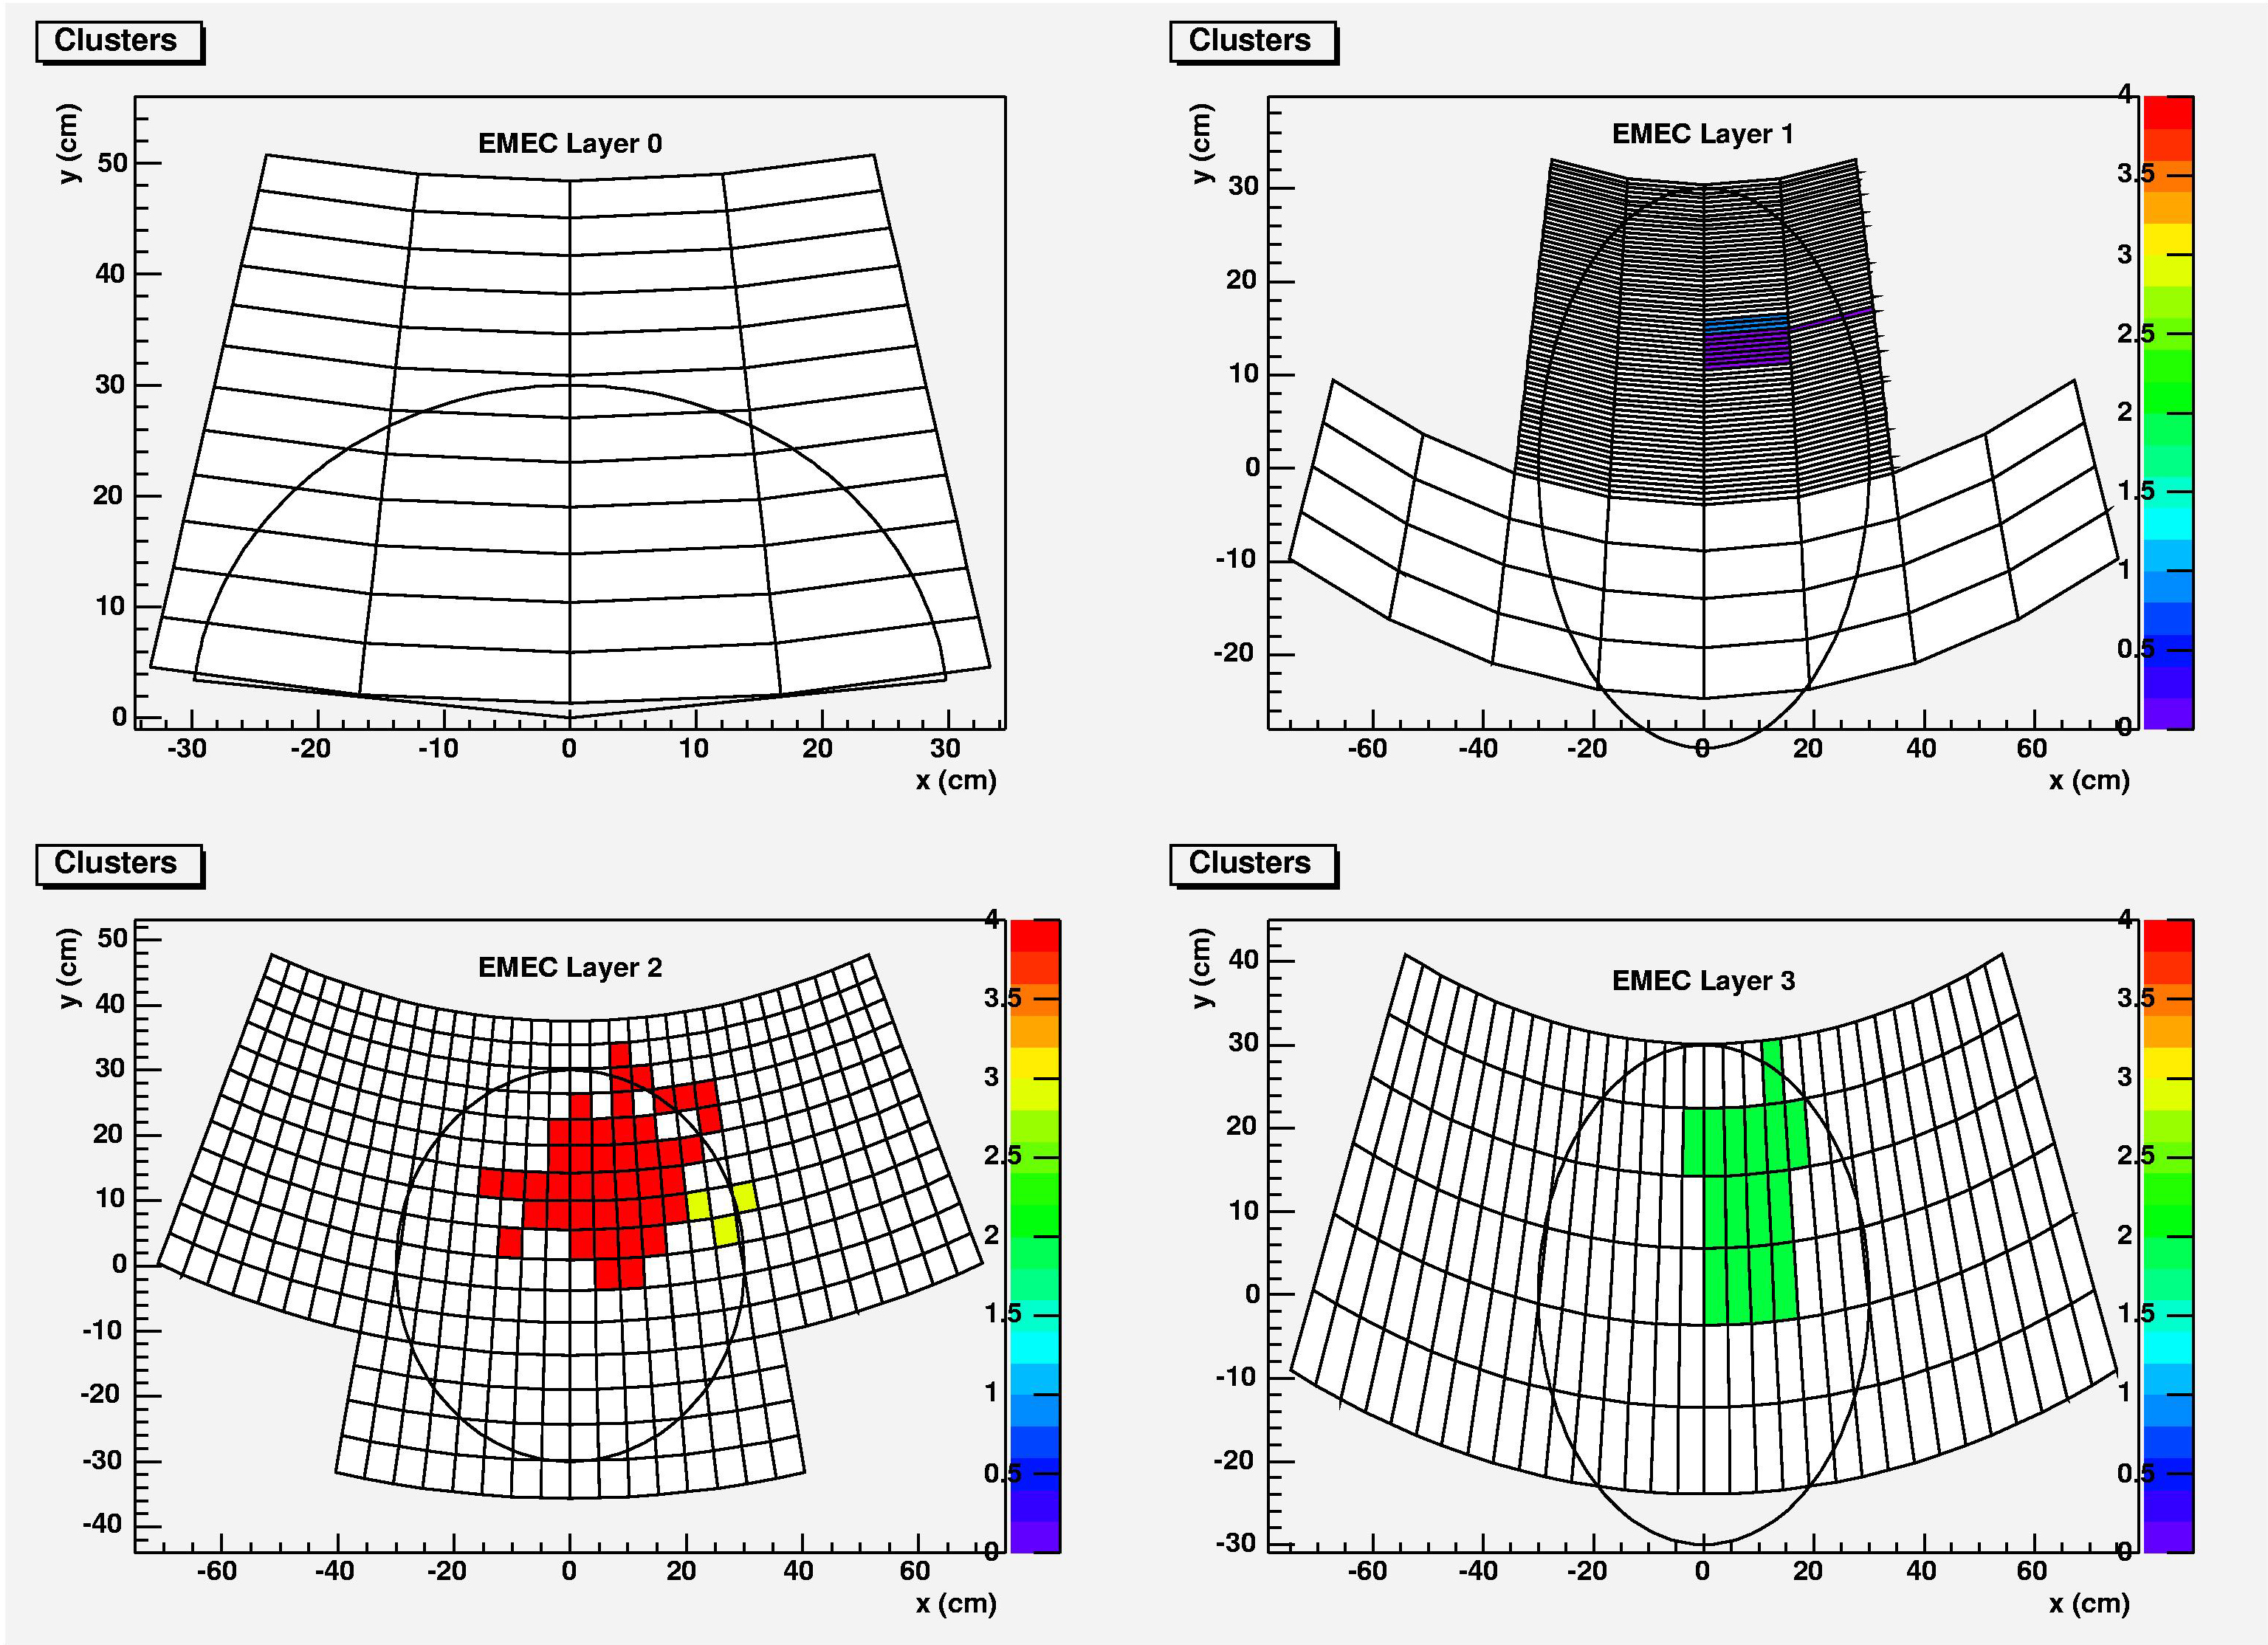
Using 3D clustering (per layer), one obtains only 2 clusters (labelled 0 and 1).